Enterprise extension
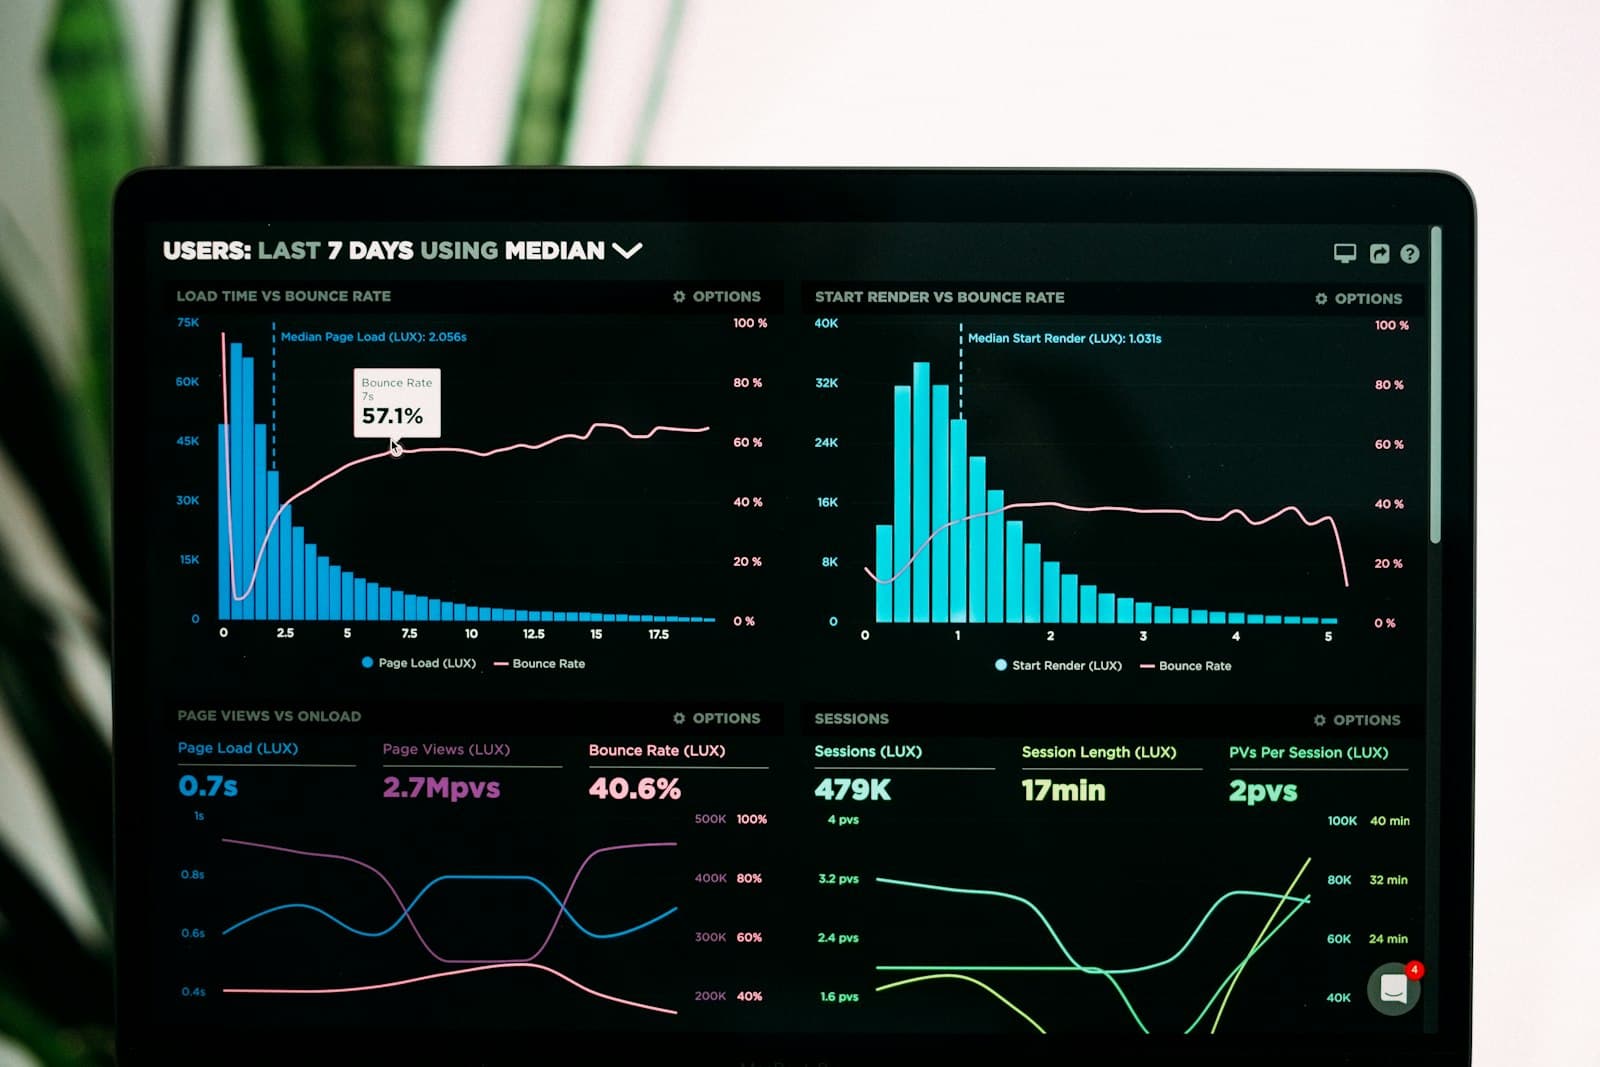
Turnaround, backlog, and quality — visible without a weekend extract
Operational and executive views built on the same regulated records. Assistive analytics can highlight patterns; they do not auto-release product.
The problem
Why this matters on the bench
When KPIs are rebuilt in spreadsheets, leadership sees a picture the lab cannot reconcile.
Capabilities
How it works
Analytics, step by step
Measure the workflow
Sample, test, and release timestamps feed operational views.
Watch quality
OOS, deviation, and CAPA volumes sit beside throughput.
Assist, don’t decide
Predictive cues are labeled as assistance. Release remains a human, signed act.
Regulatory relevance
Compliance, precisely stated
Dashboards are operational tools. They do not replace signed records or QA release decisions.
Aureon LIMS is designed to support 21 CFR Part 11 and ISO/IEC 17025 workflows. It is not FDA-approved or “Part 11 certified.” Customers remain responsible for system validation, SOP alignment, and regulatory interpretation in their own quality system.
Related modules
Questions
What evaluators ask
No. Any AI/ML layer is positioned as assistive review. Release and signatures remain human and attributable.

See analytics against your SOPs
Book a demo or talk to sales about scope and validation support.